July 1, 2025
Opening the 1975 Food Time Capsule – Diet, Health, & Food Industry
By Michael F. Jacobson
In 1975, Catherine Lerza and I, of the Center for Science in the Public Interest, edited Food for People Not for Profit (Ballantine Books), a comprehensive book about America’s food system. Now, some five decades later, it is fascinating to see what people were concerned about back then (and what they missed) and how those issues were resolved, ignored, or worsened. Did diet-related diseases become more or less prevalent; did industry become more or less consolidated and competitive; what food policies have been improved or degraded?
I have been astonished by some of the changes…and also astonished by some of the things that did not change. Some highlights:
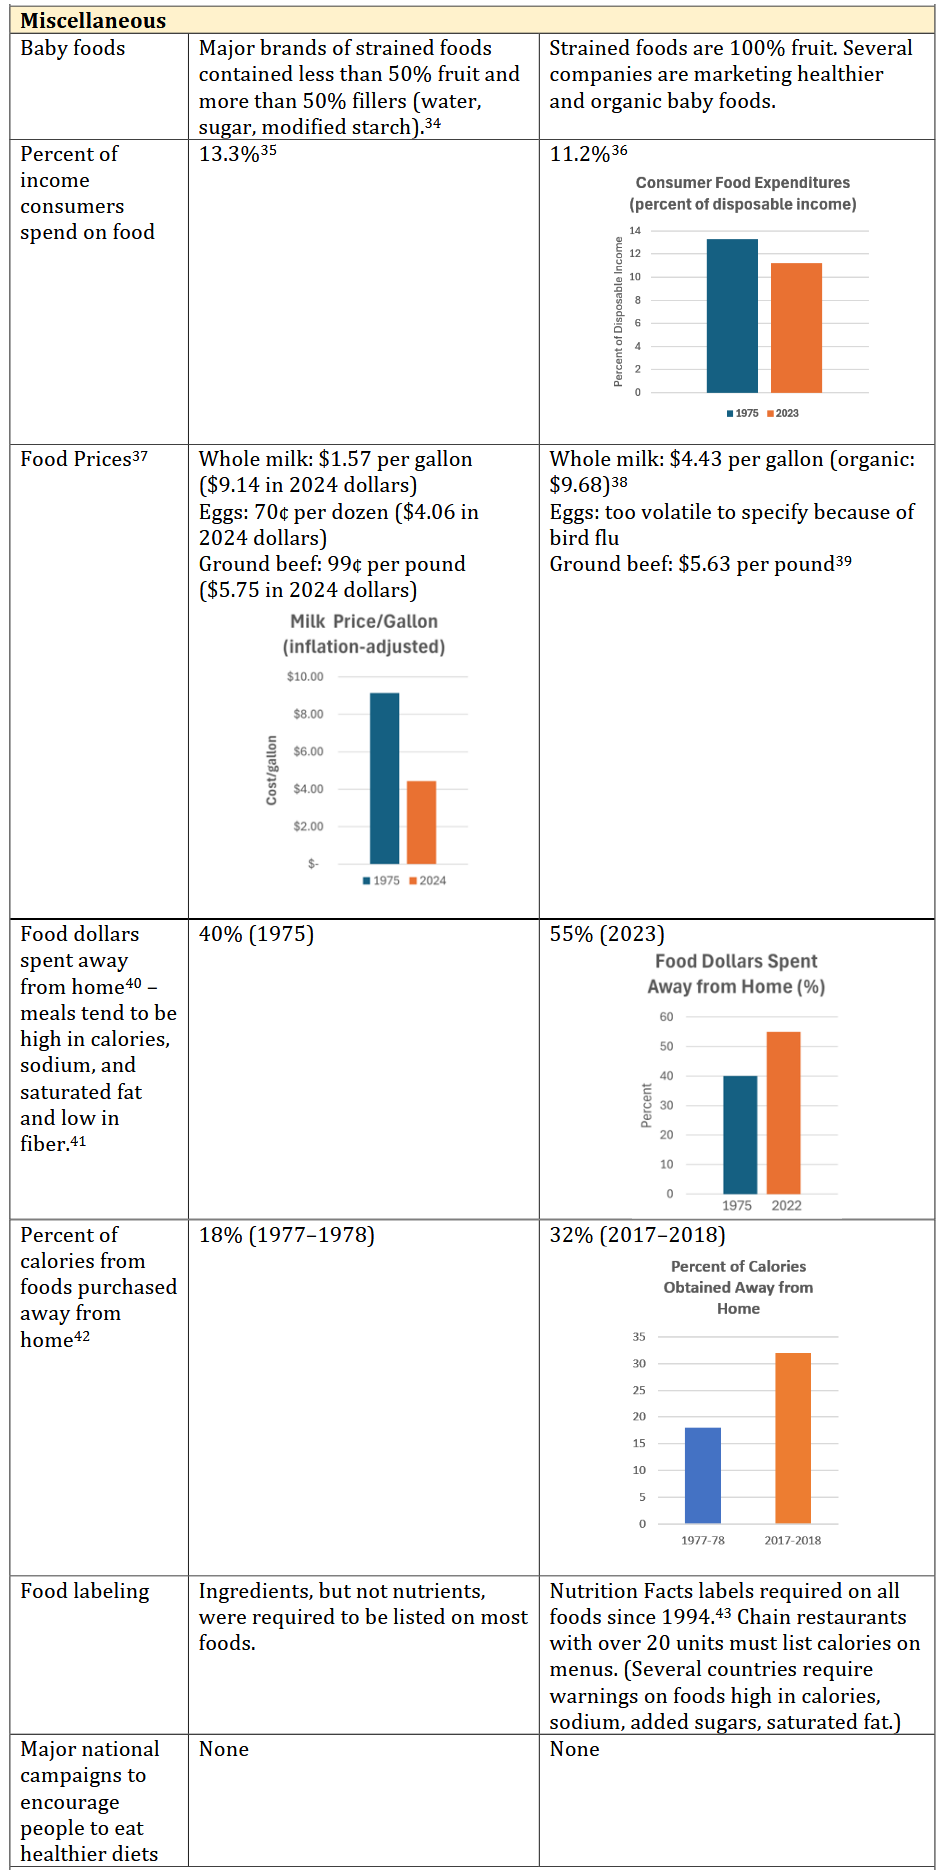
- Since 1975 the price of milk (adjusted for inflation) has dropped in half.
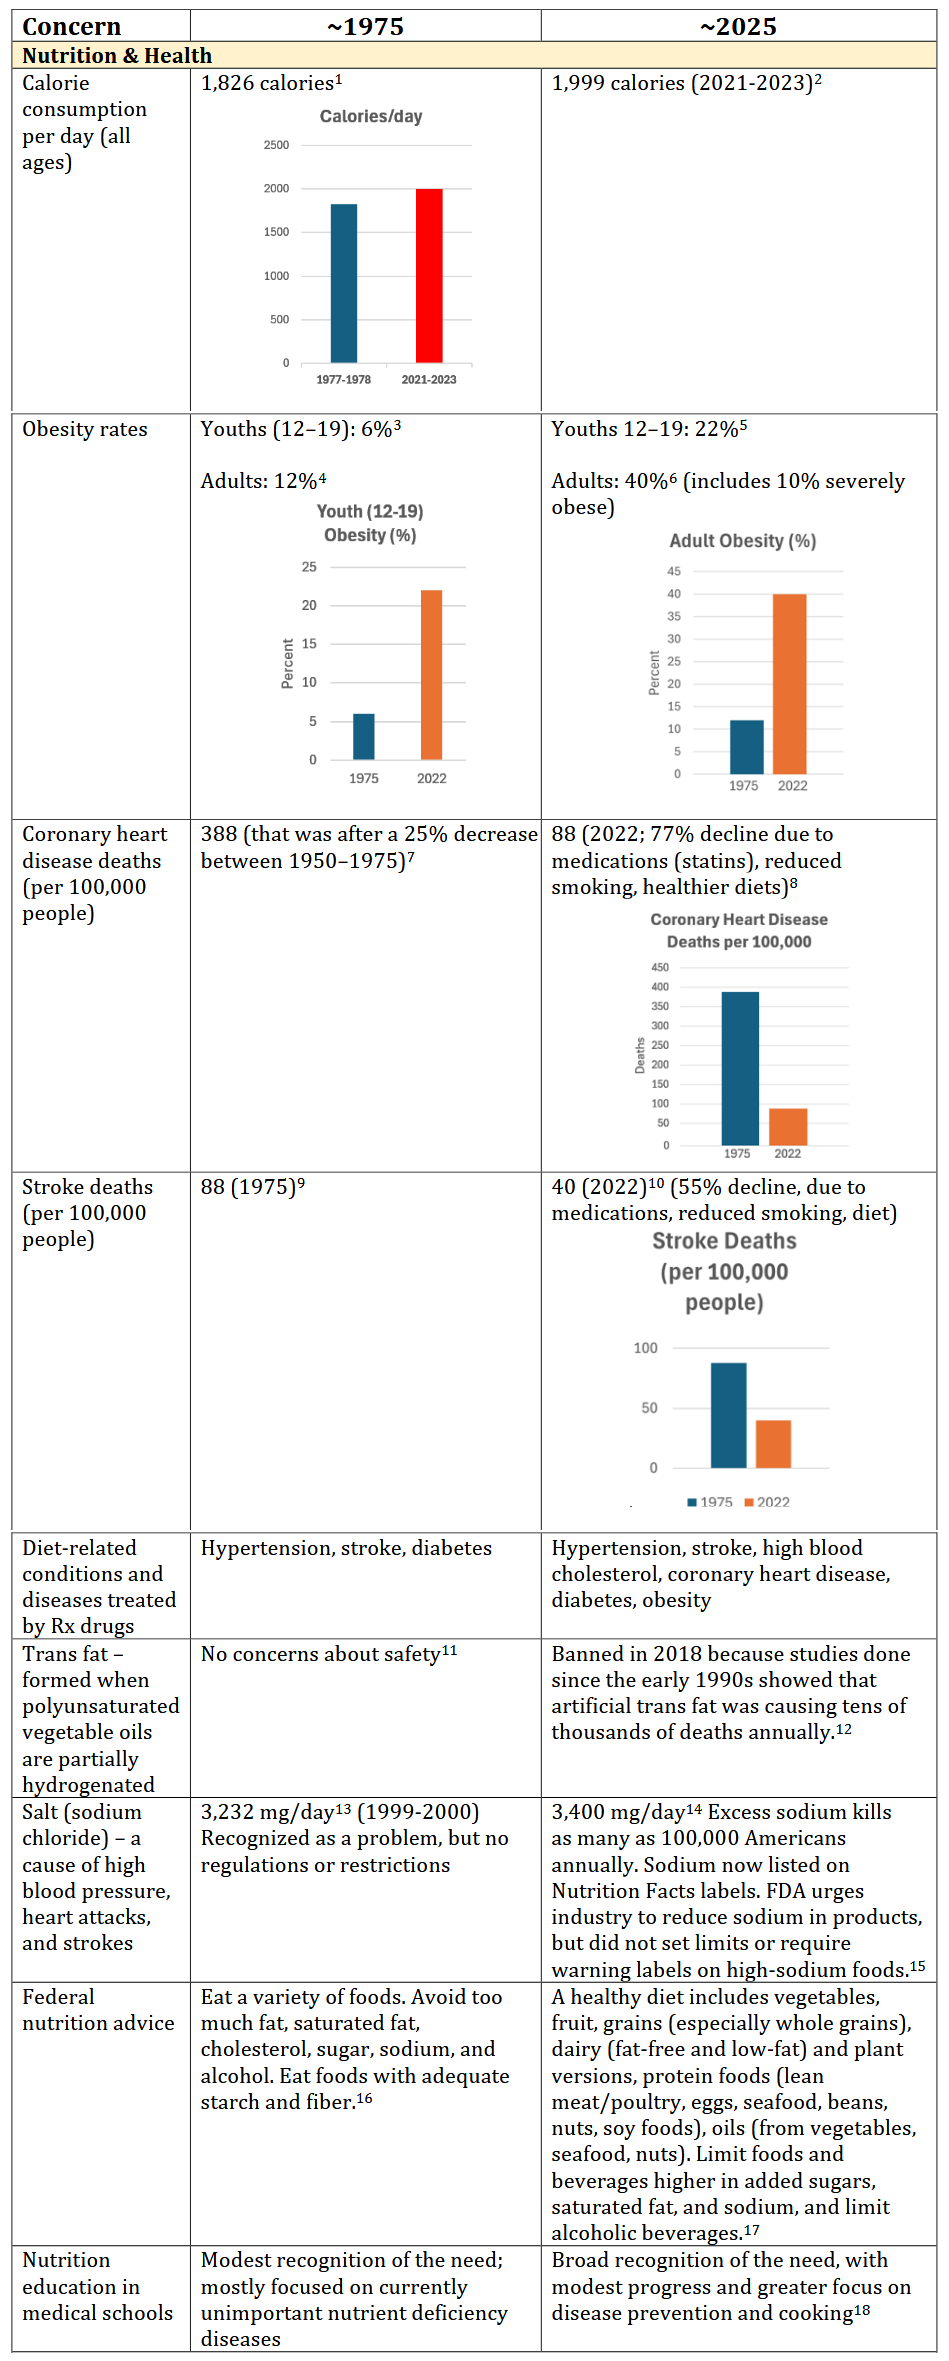
- Since 1980, obesity in youths and adults more than tripled.
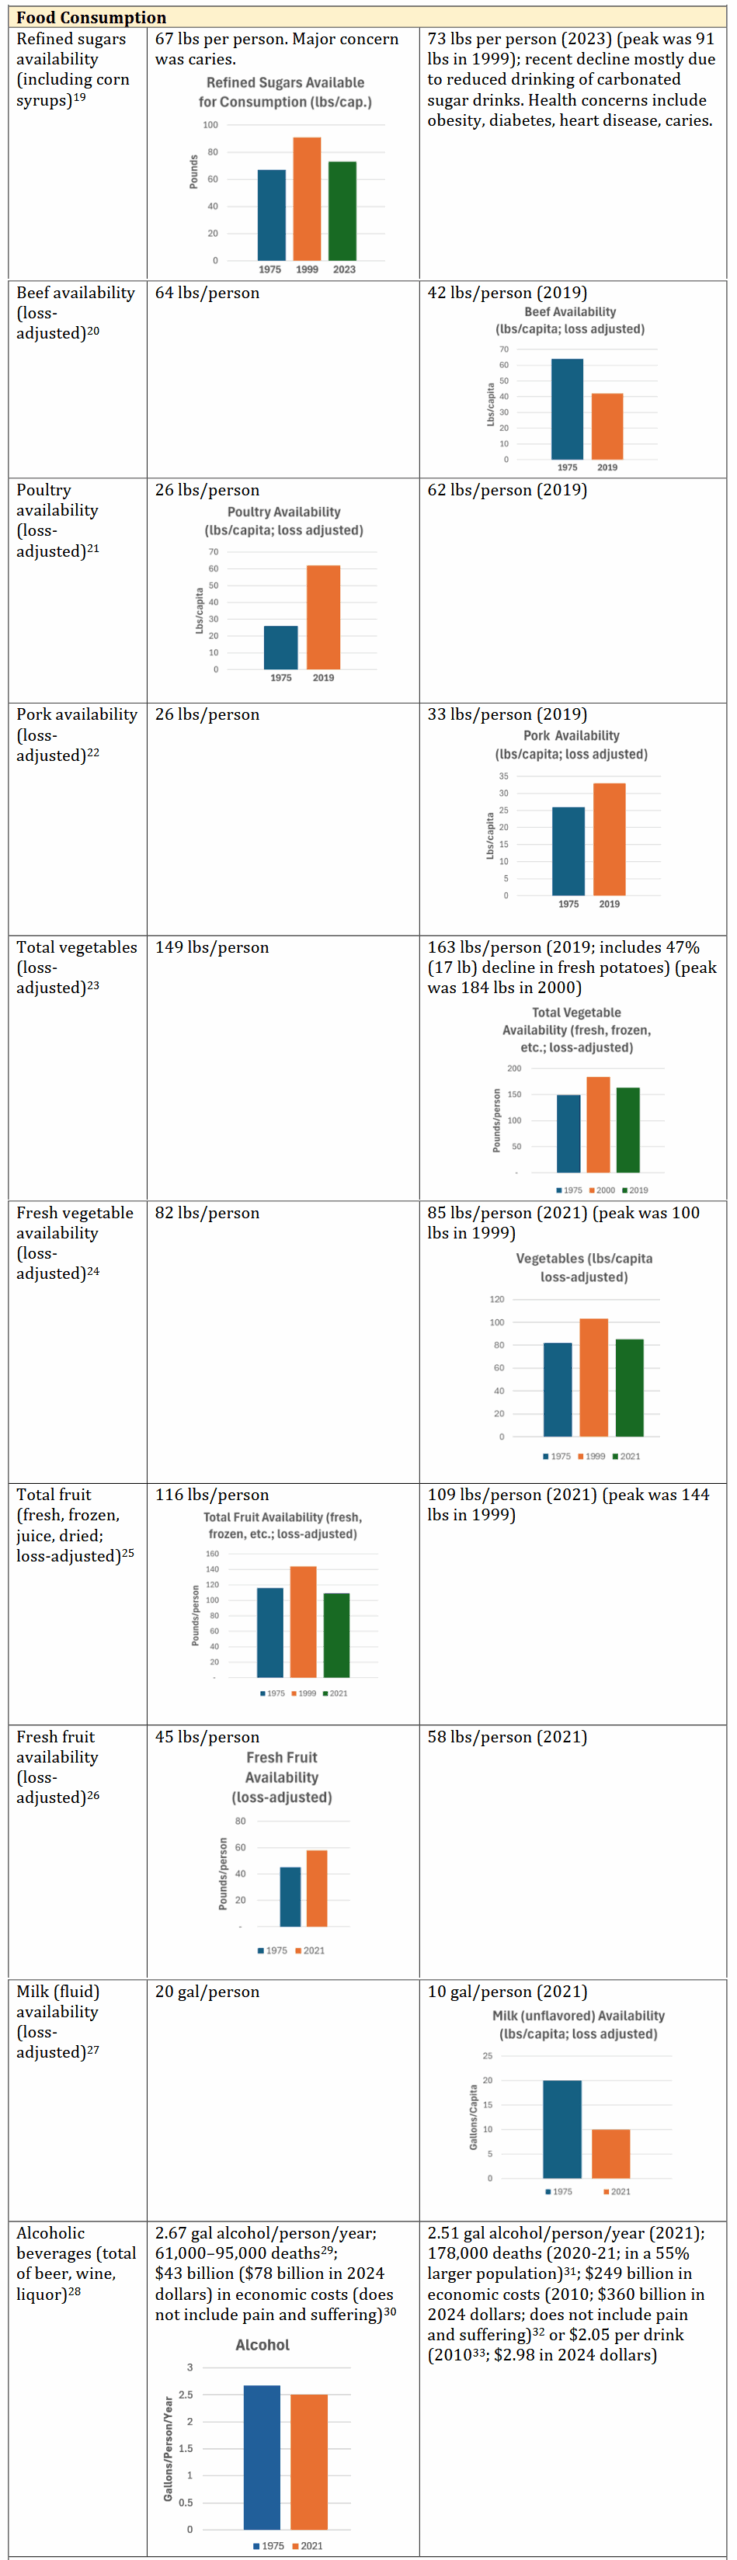
- Over the past 50 years, fresh vegetable consumption barely budged.
- Calories from eating out soared from 18 percent of total calories to 32 percent.
- Consumption of refined sugars is only about 10 percent greater than in 1975.
- We are eating one-third less beef, more than twice as much poultry, and one-fourth more pork.
- Heart disease deaths (per 100,000 people) declined by a remarkable 77 percent.
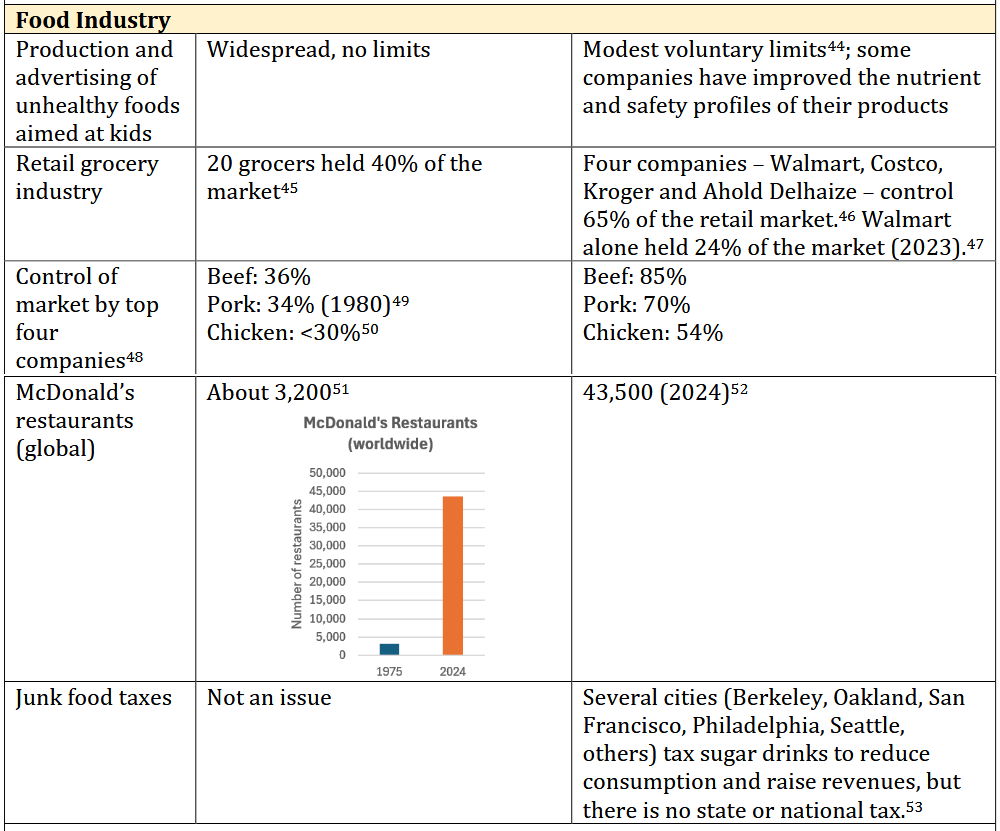
- One supermarket chain—Walmart—sells one-fourth of all groceries.
Some other notable changes:
- organic foods are a major segment of the food industry;
- food labels now provide detailed nutrition information;
- bioengineered crops were unknown 50 years ago but now constitute the vast majority of corn, soybeans, canola, and cotton;
- partially hydrogenated vegetable oil (with its artificial trans fat) has been banned because it causes heart disease.
- On the other hand:
- the marketing of junk foods for children remains unregulated;
- only a few American cities (but many countries) tax sugar drinks;
- nutrition education is still a minor after-thought in medical schools;
- the government has failed to restrict sodium in processed and restaurant foods, leading to as many as 100,000 premature deaths annually.
Sections: Nutrition & Health / Food Consumption / Miscellaneous
Food Industry / Farming / Anti-hunger Programs / Public Awareness
Endnotes
1 USDA. National Food Consumption Survey, 1977-1978, Report I-2. Agricultural Research Service.
2 USDA. Agricultural Research Service. What We Eat in America. Fact Sheet.
3 Frya CD, et al. Prevalence of Overweight and Obesity Among Children and Adolescents: United States, 1963– 1965 Through 2011–2012. CDC.gov.
4 Frya DC, et al. Prevalence of Overweight, Obesity, and Severe Obesity Among Adults Aged 20 and Over: United States, 1960–1962 Through 2015–2016. CDC.gov.
5 Childhood Obesity Facts. CDC.gov NHANES data for 2017–2020.
6 Data on obesity prevalences are from CDC.gov. NHANES data for 2021–2023: NCHS Data Brief No. 508, Sept. 2024.
7 CDC. National Vital Statistics System, Mortality: Compressed Mortality File 1968-1978. CDC WONDER Online Database, compiled from Compressed Mortality File CMF 1968-1988, Series 20, No. 2A, 2000.
8 American Heart Association. 2025 Heart Disease and Stroke Statistics: A Report of US and Global Data From the American Heart Association. Table 21-1; Pers. Comm. AHA.
9 Ananth CV, et al. Epidemiology and trends in stroke mortality in the USA, 1975–2019. International Journal of Epidemiology. 2023(June); 52:858–66.
10 CDC. Stroke Facts. Oct. 24, 2024.
11 Senti FR, ed. Evaluation of the Health Aspects of Hydrogenated Soybean Oil as a Food Ingredient. FASEB; 1976.
12 Amico A. The Demise of Artificial Trans Fat: A History of a Public Health Achievement. Milbank Q. 2021 Sep;99(3):746-770.
13 Brouillard, A. M. et al., Trends in Dietary Sodium Intake in the United States and the Impact of USDA Guidelines: NHANES 1999-2016. Am J Med., 132:10, 1199 - 1206.e5.
14 U.S. Food and Drug Administration, Sodium in Your Diet, 2024.
15 Jacobson MF. Salt Wars: The War Over the Biggest Killer in the American Diet. (MIT Press, 2020)
16 U.S. Departments of Agriculture and Health and Human Services. Dietary Guidelines for Americans. (1980)
17 U.S. Departments of Agriculture and Health and Human Services. Dietary Guidelines for Americans 2020– 2025. (2020)
18 Millard E. How Nutrition Education for Doctors is Evolving. Time. May 24, 2023.
19 Economic Research Service. USDA. Sugar and sweeteners; loss-adjusted food availability. Sept. 27, 2024.
20 Economic Research Service. USDA. Loss -Adjusted Food Availability.
21 Economic Research Service. USDA. Loss-Adjusted Food Availability.
22 Economic Research Service. USDA. Loss-Adjusted Food Availability.
23 Economic Research Service, USDA, Loss-Adjusted Food Availability.
24 Economic Research Service. USDA. Loss-Adjusted Food Availability.
25 Economic Research Service. USDA. Loss-Adjusted Food Availability.
26 Economic Research Service. USDA. Loss-Adjusted Food Availability.
27 Economic Research Service. U.S. Department of Agriculture. Loss-Adjusted Food Availability.
28 Apparent Per Capita Alcohol Consumption: National, State, and Regional Trends, 1977–2021, Surveillance Report #120, National Institute on Alcohol Abuse and Alcoholism, April 2023.
29 National Research Council (US) Panel on Alternative Policies Affecting the Prevention of Alcohol Abuse and Alcoholism; Moore MH, Gerstein DR, editors. National Academies Press (US). 1981.
30 Gurstein D. Alcohol Use and Consequences.
31 National Institute on Alcohol Abuse and Alcoholism. Alcohol-related emergencies and deaths in the United States. Nov. 2024.
32 CDC. Addressing Excessive Alcohol Use: State Fact Sheets. (2024 update)
33 CDC. Excessive alcohol use continues to be drain on American economy. Oct. 15, 2015.
34 Jacobson MF. “Cheating Babies.” Center for Science in the Public Interest. 1996. Also: Center for Science in the Public Interest petition to the FTC on Gerber’s deceptive advertising. Feb. 14, 1996.
35 USDA. Economic Research Service. Zeballos E, Sinclair W. Aug. 14, 2023.
36 USDA. Economic Research Service. Zeballos E, Rivera-Cintron D, Sinclair W. Amber Wavs. Oct. 8, 2024.
37 Dimberg K. Taste of Home. This Is What Groceries Cost the Year You Were Born. July 11, 2024.
38 Cornell University. Retail Milk Prices Report. Dec. 2024.
39 U.S. Bureau of Labor Statistics. Nov. 2024.
40 Economic Research Service. USDA. Interactive Charts: Food Expenditures
41 Saksena MJ. Economic Research Service. U.S. Department of Agriculture . America’s Eating Habits: Food
Away From Home. Sept. 2018.
42 Economic Research Service. U.S. Department of Agriculture. Percent of calories consumed at food-away- from-home establishments rose almost 74 percent from 1977–1978 to 2017–2018. (2024)
43 Wikipedia.
44 Better Business Bureaus. Children’s Food and Beverage Advertising Initiative. Frequently Asked Questions. Nutrition Criteria.
45 Search on Microsoft Bing (exact sources unclear).
46 Guardian, Food and Water Watch. The True Extent of America’s Food Monopolies, and Who Pays the Price. July 21, 2021.
47 Statista. Leading grocery stores in the United States in 2022 and 2023, by market share.
48 McDonald JM. USDA. Concentration in U.S. Meatpacking Industry and How It Affects Competition and Cattle Prices. Amber Waves. Jan. 25, 2024.
49 Tridge. USA: Evolution of meat processing companies. July 14, 2023.
50 WattPoultry. Chicken Industry. Dec. 3, 2007.
51 ChatGPT interpolation between 1974 and 1975 (June 12, 2025)
52 Statista. Number of McDonald's restaurants from 2005 to 2024.
53 Young DR, et al. City-Level Sugar-Sweetened Beverage Taxes and Youth Body Mass Index Percentile. JAMA Netw Open. 2024;7(7). July 31, 2024.
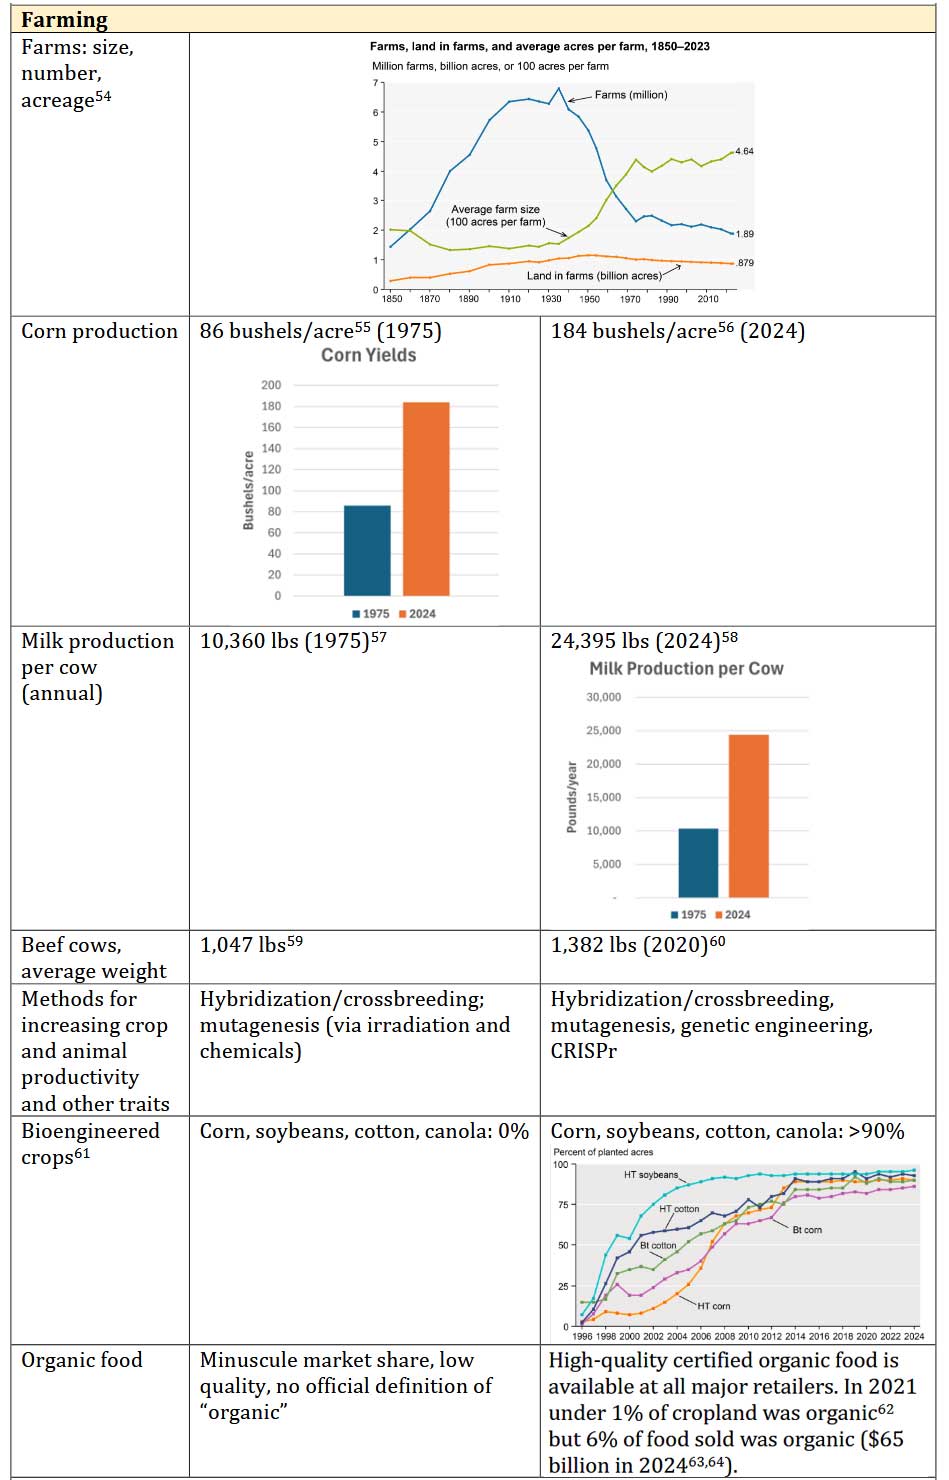
54 USDA. Economic Research Service, National Agricultural Statistics Service, Census of Agriculture (through 2022) and Farms and Land in Farms: 2023 Summary. Feb. 2024.
55 USDA. Crop Production Historical Track Records. Corn Area Planted and Harvested, Yield, Production, Utilization, Price, and Value—United States: 1866-2018. April 2019.
56 USDA. National Agricultural Statistics Service. News Release—US corn production up while soybean production down from September.
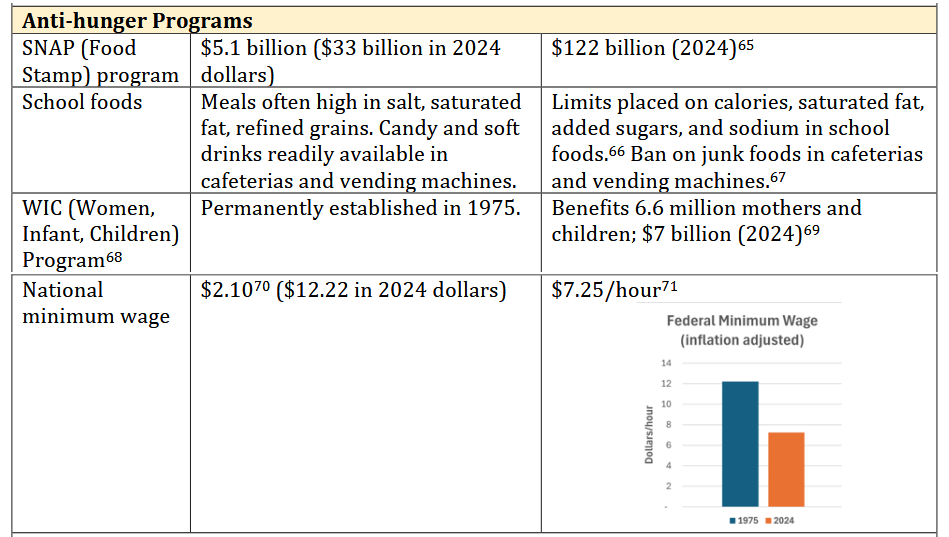
57 USDA. Economic Research Service, National Agricultural Statistics Service. Appendix table 1—U. S. milk production, 1950-2000.
58 Statista. Milk produced per cow in the United States from 1999 to 2024 (in pounds).
59 Scatcha JD, et al. Beef Cow Size: Industry Trends, Economics, and Implications for Grazing Wyoming Rangelands. University of Wyoming Extension.
60 National Beef Wire. Cattle Weights By Month.
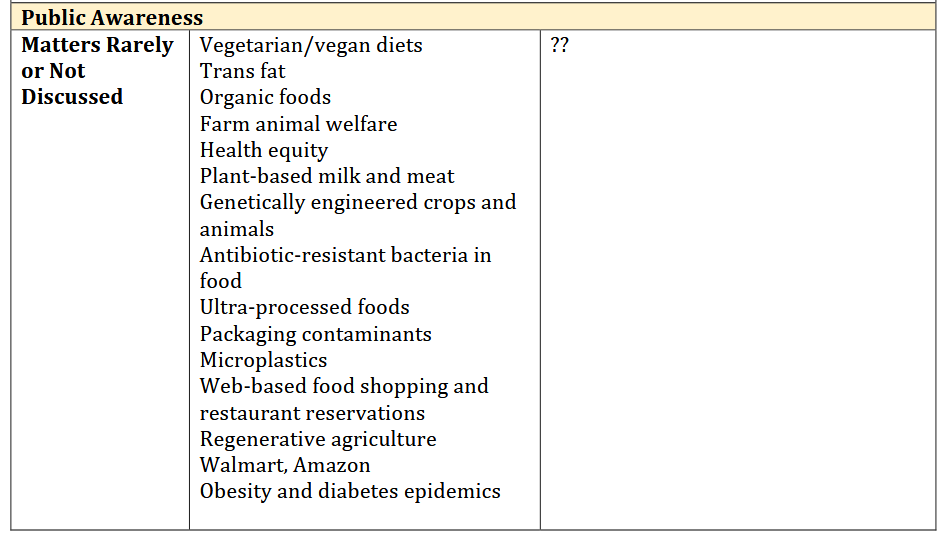
61 USDA. Economic Research Service. Adoption of Genetically Engineered Crops in the United States. Jan 4, 2025.
62 Skorbiansky SR, et al. Amber Waves. USDA. Rising Consumer Demand Reshapes Landscape for U.S. Organic Farmers. Nov. 14, 2023.
63 Statista. Organic food sales in the United States from 2005 to 2023.
64 Organic Trade Association. Organic food sales break through $60 billion in 2022.
65 USDA. FY 2024 Budget Summary.
66 Food and Nutrition Service. USDA. Nutrition Standards for School Meals. Dec. 4, 2024.
67 Food and Nutrition Service. USDA. National School Lunch Program and School Breakfast Program: Nutrition Standards for All Foods Sold in School as Required by the Healthy, Hunger-Free Kids Act of 2010. July 29, 2016.
68 National WIC Association. WIC Program Overview and History. 2024.
69 Center for Budget and Policy Priorities. 2024 Appropriations Agreement Fully Funds WIC and Rejects Harmful Food Package Proposals, Creating Opportunities to Reach More Eligible Low-Income Families. March 25, 2024.
70 U.S. Department of Labor. History of Changes to the Minimum Wage Law.
71 USA.gov. Minimum Wage. Dec. 6, 2023.